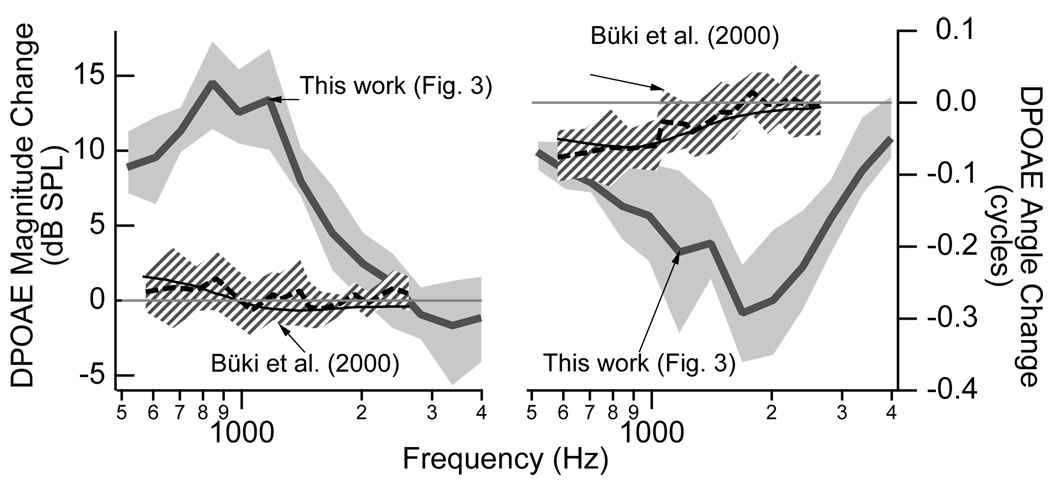
Figure 5.
Comparison of changes (upright minus tilted) in DPOAE magnitudes (left) and angles (right) between the work presented here in Fig. 3 and that presented by Büki et al. (2000). The postural changes were from upright to −45° in this work and from upright to −30° in Büki et al. (2000). The mean data from Büki et al. (2000) is represented by the dashed black line with the hashed area indicating ±1 standard deviation, and the solid black line represents a model prediction. As presented in Fig. 3, the gray line indicates the mean changes from the work here with the 25–75% range shaded in gray.

