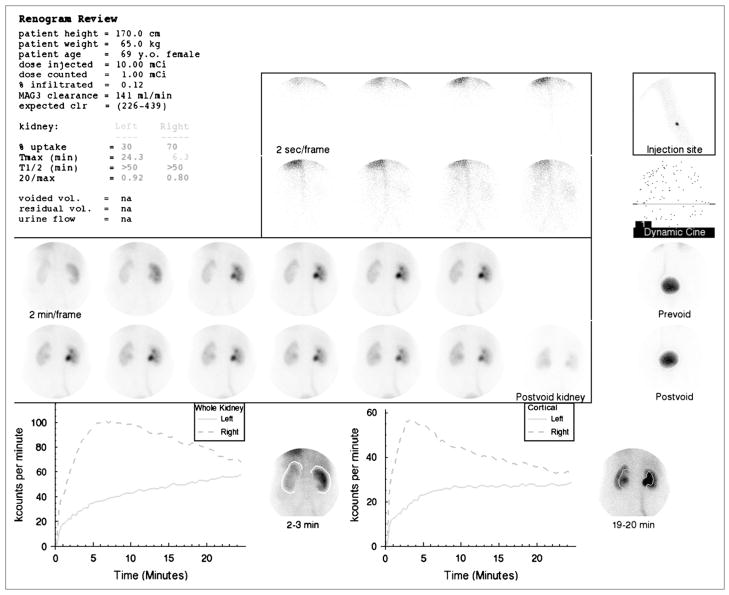
FIGURE 1.
Standard display shows demographic data, dose injected, dose counted on camera, percent dose infiltrated, 99mTc-MAG3 clearance and expected 99mTc-MAG3 clearance followed by percent uptake, Tmax, T1/2, and 20 min/max ratios for whole-kidney ROI. Voided volume, postvoid residual, and urine flow rate were not measured. (Upper central panel) Two-second images at beginning of acquisition. (Upper right panel) Injection site; just beneath is a frame for viewing dynamic cine and pre- and postvoid bladder images. (Center panel) Twelve 2-min images followed by postvoid image of kidneys with patient lying on camera in same position as that for initial images. (Lower left panel) Whole-kidney ROIs and whole-kidney renogram curves. (Lower right panel) Cortical ROIs and cortical renogram curves. 99mTc-MAG3 clearance was reduced (141 mL/min/1.73m2 compared with normal range of 226–439 mL/min/1.73 m2). Relative uptake of left kidney was 30%. T1/2 of both kidneys was >50 min and 20 min/max ratio was bilaterally abnormal; consequently, patient received furosemide followed by a second acquisition (Fig. 2 and Supplemental Fig. 2).

