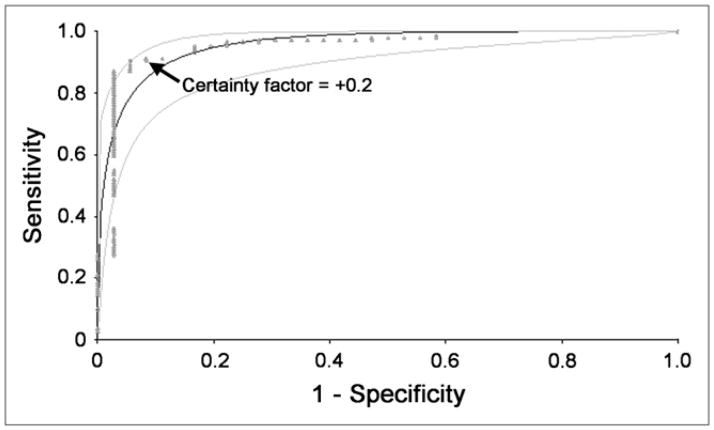
FIGURE 3.
Clinical data were used to confirm that +0.2 was an acceptable certainty factor for RENEX to separate obstructed kidneys from the combined group of equivocal and non-obstructed kidneys. Kidneys considered to be equivocal or obstructed by consensus analysis were combined, and ROC curves were constructed to compare performance of RENEX with consensus interpretation with regard to distinguishing between obstructed kidneys and the combined group of nonobstructed and equivocal kidneys. ROC analysis was performed for certainty factors ranging from −1.0 to +1.0. Plot of this analysis confirms the certainty factor of +0.2 to be an acceptable threshold for separating obstructed kidneys from the combined group. Fitted ROC curve and its 95% confidence bands are shown as smooth curves. Empiric ROC curve is shown in dots.

