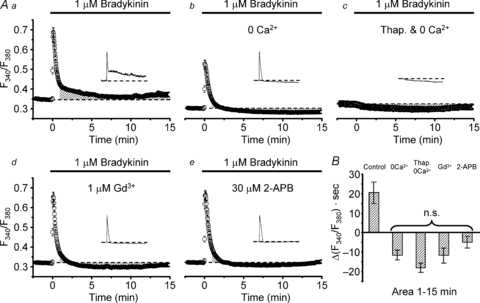
Figure 1. Effects of Ca2+ depletion and blockers of Ca2+ entry on bradykinin-induced [Ca2+]i rises in cultured mouse astrocytes.

Aa, bradykinin-induced rise in fura-2 ratio (F340/F380) in the cytoplasm averaged over 78 cells. Ab, bradykinin-induced F340/F380 rise in the absence of extracellular Ca2+ (n = 75). EGTA was not added in the bathing solution. Ac, bradykinin response in the absence of extracellular Ca2+ observed after pretreatment with 1 μm thapsigargin (Thap.) for 30 min (n = 69). Thapsigargin was included in the loading solution but not in the bathing solution. Ad, response in the presence of 1 μm Gd3+ (n = 90). Ae, response in the presence of 30 μm 2-APB (n = 85). Cells were preincubated in the Gd3+ or 2-APB containing solution for 10 min at room temperature before the measurements. Insets in Aa–e show typical F340/F380 traces observed in single cells for 15 min. All traces in this figure were recorded with a Roper NTE camera. B, comparison of the time integrals of net F340/F380 rises (areas in Δ(F340/F380) × seconds) from basal levels (indicated by dashed lines in Aa–e) over 1–15 min after the beginning of bradykinin application. The areas for comparison are indicated as shaded regions in Aa–e. All the areas except that in the control conditions (Aa) had negative values. This was presumably due to a temporary facilitating effect of bradykinin on Ca2+ extrusion (Ac). There are no statistical differences between these negative values (judged by multiple comparisons).
