
Figure 4. Effects of TRPC1 knockdown on bradykinin-induced VSOR currents.
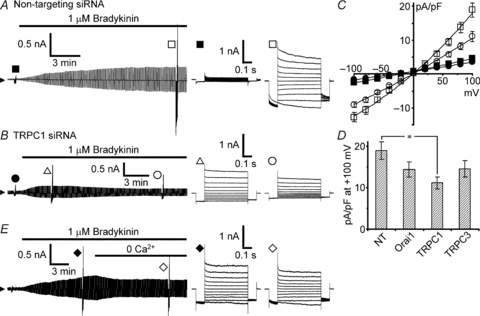
Bradykinin-induced VSOR currents were monitored during application of voltage pulses as in Fig. 2A. A, bradykinin-induced VSOR current in non-targeting siRNA-transfected cells. B, an example showing a waxing and waning pattern of current development induced by bradykinin in TRPC1 siRNA-transfected cells. This pattern was seen in the majority of the cells (22 of 31 cells). C, I–V relationships measured 20 min after the beginning of bradykinin application in these transfected cells. Filled symbols indicate the mean values before application of bradykinin, and open symbols indicate those after 20 min. The numbers of cells analysed were 29 for non-targeting siRNA (squares) and 31 for TRPC1 siRNA (circles). D, comparison of the peak amplitudes of the currents evoked by voltage pulses to +100 mV between the cells transfected with the siRNAs for Orai1 (n = 32), TRPC1 and TRPC3 (n = 27) and the cells with non-targeting (NT) siRNA. Only the amplitude in TRPC1 knockdown cells was significantly suppressed (asterisk, P < 0.05 by multiple comparisons). The examples of current traces and the I–V relationships in Orai1-knockdown and TRPC3-knockdown cells are shown in Supplemental Fig. S2. E, effect of extracellular Ca2+ removal during the course of bradykinin-induced current development. The trace is a representative of three separate experiments.