
Figure 7. Bradykinin-induced ROS generation through NOX and its sensitivity to a blocker of Ca2+-dependent PKC and to Ca2+ depletion.
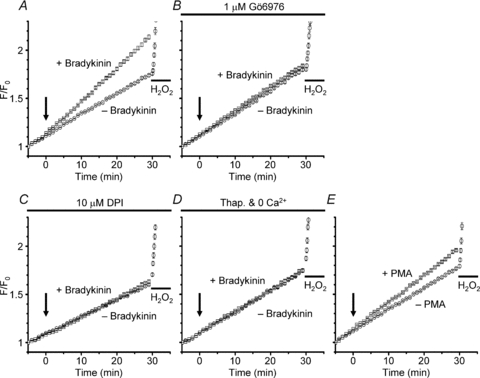
A, comparison of the time courses of increases in normalized fluorescence (F/F0) of CM-DCF with and without application of bradykinin. Bradykinin at 1 μm (+ Bradykinin) or a blank bathing solution (– Bradykinin) was applied 5 min after the beginning of observation (at time 0, indicated by the arrow). The fluorescence was measured at 10 s intervals, and each point in the plot represents the averaged F/F0 value over 1 min. To check the responsiveness of CM-DCF to exogenous ROS, 1 mm H2O2 was applied at 30 min in the ‘− Bradykinin’ condition. The traces are the averages over 148 cells in the ‘+ Bradykinin’ condition (squares) and 164 cells in the ‘− Bradykinin’ condition (circles), respectively. The larger F/F0 rise at 30 min in the ‘+ Bradykinin’ condition is significant at P < 0.01 by ANOVA. The F/F0 rise in the ‘− Bradykinin’ condition would be mostly caused by the photo-oxidation of CM-DCF, since similar amplitudes of the rises were generated even in the presence of a NOX blocker, DPI, as shown below in C. B, suppression of bradykinin-induced F/F0 rise in the presence of 1 μm Gö6976. Gö6976 was included also during dye loading. The traces are from 154 cells in the ‘+ Bradykinin’ condition (squares) and 139 cells in the ‘− Bradykinin’ condition (circles). C, suppression of the F/F0 rise in the presence of 10 μm DPI. The traces are the averages over 227 cells in the ‘+ Bradykinin’ condition (squares) and 230 cells in the ‘− Bradykinin’ condition (circles). D, suppression of the F/F0 rise in the absence of extracellular Ca2+ observed after pretreatment with thapsigargin. Thapsigargin at 1 μm was included in the loading solution but not in the bathing solution. EGTA at 0.1 mm was added to the 0 Ca2+ bathing solution. The traces are from 202 cells in the ‘+ Bradykinin’ condition (squares) and 195 cells in the ‘− Bradykinin’ condition (circles). E, F/F0 rise induced by 1 μm PMA. PMA or a blank solution (– PMA) was applied at time 0 (indicated by the arrow). The traces are from 205 cells in the ‘+ PMA’ condition (squares) and 181 cells in the ‘− PMA’ condition (circles). The larger F/F0 rise at 30 min in the ‘+ PMA’ condition is significant at P < 0.01 by ANOVA.