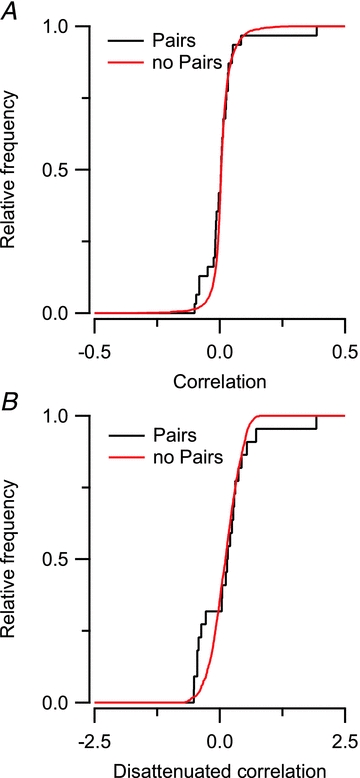
Figure 7. Neighbouring neurons and non-neighbouring neurons show comparable cross-correlations of their frequency response areas.

A, cumulative histogram comparing the distribution of cells measured as a pair and cells that were not measured as a pair. B, cumulative histogram comparing the disattenuated correlation between neighbouring and non-neighbouring neuron pairs.
