
Figure 7. Glucose tolerance tests at 3 months of age.
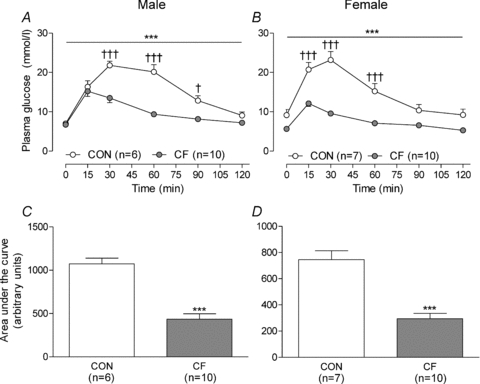
Plasma glucose measured over 2 h following an intraperitoneal injection (1 g kg−1) of glucose (A and B) and area under the glucose curve (C and D) in male (A and C) and female (B and D) control (CON) and cross-fostered (CF) offspring at 3 months of age. Data expressed as means ± SEM. ***P < 0.001 vs. CON, RM AMOVA (A and B) or unpaired t test (C and D). †P < 0.05, †††P < 0.001 vs. CON, Bonferroni post hoc test following RM ANOVA (A and B).