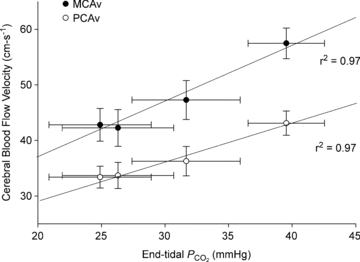
Figure 4. Relationship between the group average middle cerebral artery blood flow velocity (MCAv) and posterior cerebral artery blood flow velocity (PCAv) and the group average end-tidal  over a wide range of body temperatures (from right to left: normothermic baseline, +1.0°C above baseline, +1.5°C above baseline and +1.8°C above baseline).

Both relationships were significant (P < 0.05). n = 8, protocol II.
