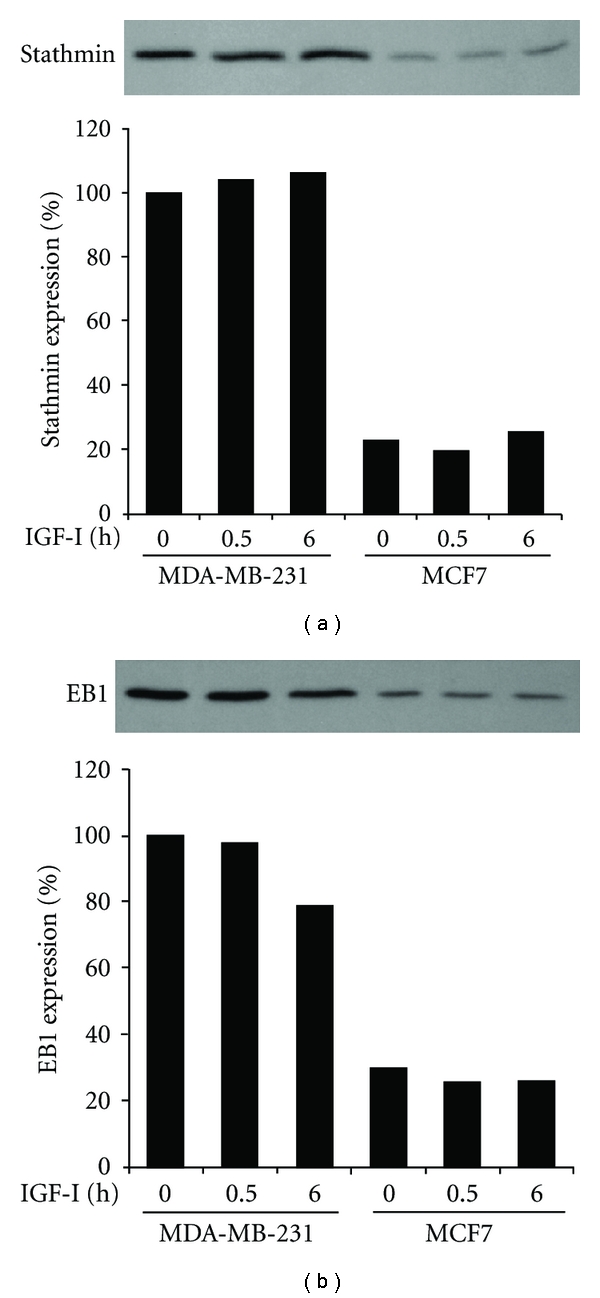
Figure 5.

Overexpression of stathmin and EB1 in MDA-MB-231 cells compared to MCF7 cells. Cells after stimulation with IGF-I for 0, 0.5, or 6 h were lysed and processed for immunoblotting with antibodies to stathmin (a) and EB1 (b). Band intensity was measured, and values are given as expression relative to that in unstimulated control MDA-MB-231 cells.
