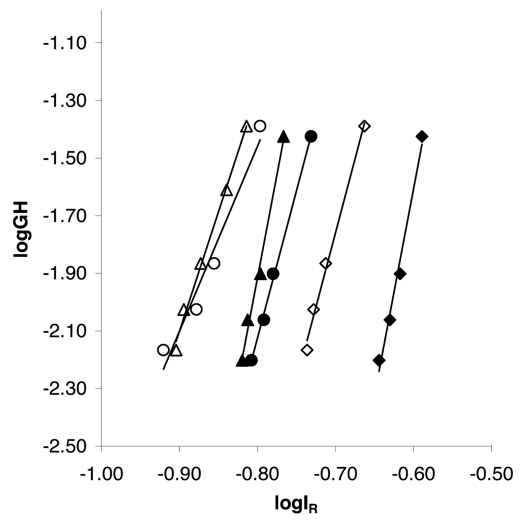
Figure 2.
GH-IR-plots for the monoclonal antibody mAb01 and the resins Eshmuno™ S and Fractogel® SO3− (M) at different pH values. Linear gradient elutions were performed with 3.93 mL Superformance columns (10 mm i.d. x. 50 mm L) at a linear flow rate of 119 cm/h and gradient lengths of 15–90 CV from 0–1 M NaCl. The protein load was 0.44 mg/mL packed resin. Filled symbols represent Fractogel® SO3−, blank symbols Eshmuno™ S. Rhombes represent pH 5, circles pH 5.5 and triangles pH 6.

