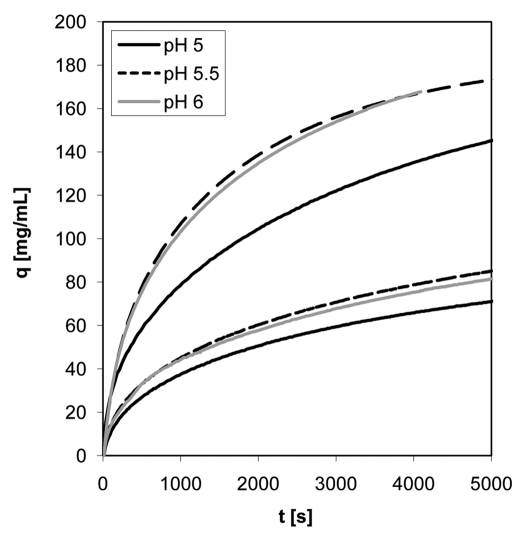
Figure 3.
Uptake-curves from stirred batch experiments with mAb01 for Eshmuno™ S and Fractogel® SO3− (M). The three lower curves belong to Fractogel® SO3−, the three upper curves to Eshmuno™ S. Experiments were performed with 100 mL protein solution and 0.5 mL sedimented resin. The initial protein concentration was 1 mg/mL.

