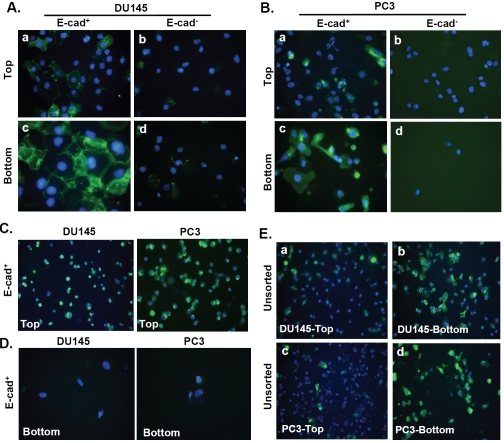
Figure 2.
Analysis of E-cadherin expression during invasion in E-cad+, E-cad- and unsorted DU145 and PC3 cells. (A) and (B) Images of E-cad+ and E-cad- DU145 and PC3 cells immunostained with E-cadherin antibody after 24 h of invasion. Duplicate Matrigel invasion chambers were used: one each for staining invaded (bottom chamber) and non-invaded (top chamber) cells. Cells that were not stained were removed from each insert. Non-invaded cells from plated E-cad+and E-cad- subpopulations of DU145 and PC3 cells stained on the upper face of the membrane are shown in A-a/b and B-a/b, respectively. Invaded cells from both cell subpopulations (DU145 and PC3) were stained on the underside of the membrane, as shown in A-c/d and B-c/d. Magnification, 40x. (C) After 1 h, E-cad+ cells in the top chamber (DU145; left panel, PC3; right panel) were stained for E-cadherin (10x). (D) After 4 h, invaded E-cad+ cells at the bottom of the membrane (DU145; left panel, PC3; right panel) were stained for E-cadherin (40x). (E) Top-chamber (a and c) or invaded (b and d) unsorted DU145 and PC3 cells respectively were immunostained with an E-cadherin antibody at the conclusion of a 24 h invasion assay.

