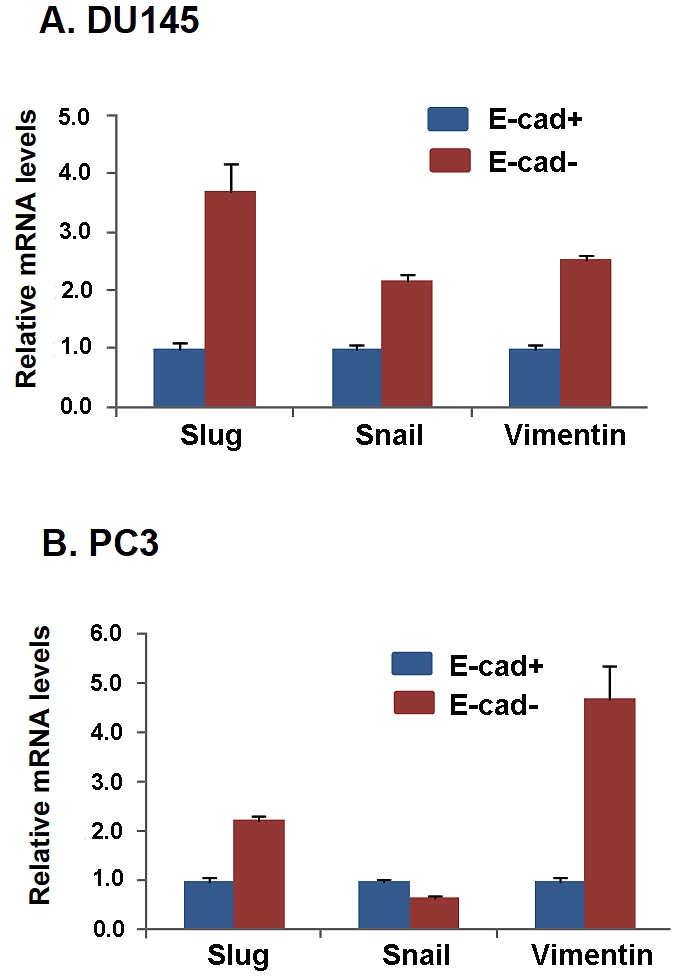
Figure 4.

Difference of expression levels of Slug, Snail and Vimentin between E-cad+and E-cad- cells isolated from parental DU145 and PC3 cells. Both E-cad+ and E-cad- DU145 (A) and PC3 (B) cells were analyzed for expression levels of Slug, Snail, and Vimentin by qPCR. Expression levels were normalized to actin. The data are reported as the mean ± SD.
