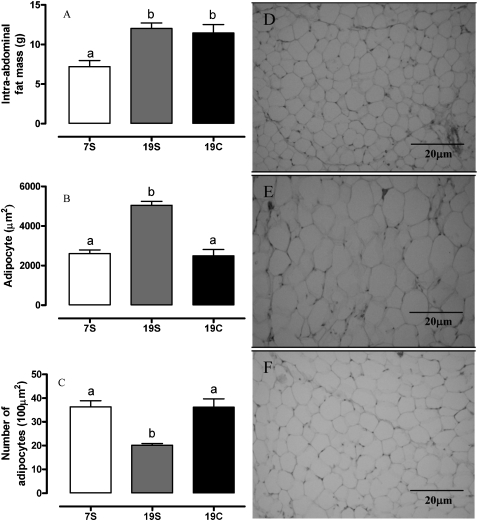
(A) Intra-abdominal fat mass. (B) Adipocyte size and (C) number of retroperitoneal adipocytes. Groups fed with control diet (7S, n = 12) or with high fat diet containing soybean (19S, n = 12) or canola oil (19C, n = 12), at 60 days. a,bValues with different superscripts are significantly different (one-way ANOVA; p<0.05). Photomicrographs of the adipose tissue staining with Hematoxylin-Eosin (original magnification 200X): (D) 7S, (E) 19S and (F) 19C groups.

An official website of the United States government
Here's how you know
Official websites use .gov
A
.gov website belongs to an official
government organization in the United States.
Secure .gov websites use HTTPS
A lock (
) or https:// means you've safely
connected to the .gov website. Share sensitive
information only on official, secure websites.
