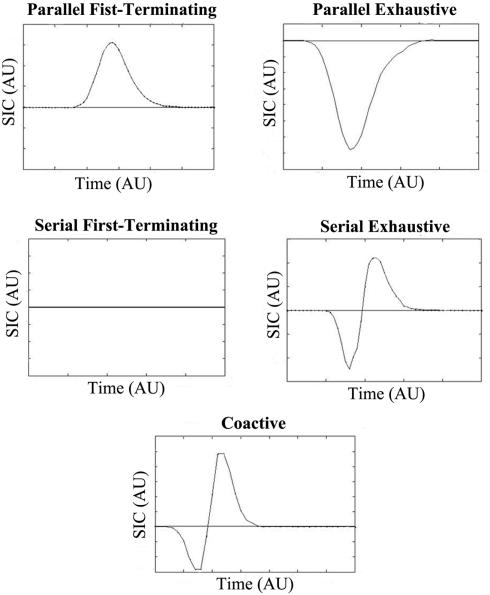
Figure 2.
SIC(t) predictions for standard independent parallel, serial, and coactive models. The two top panels display the predictions of the independent parallel first-terminating and exhaustive models respectively, while the middle panels display the predictions of the serial first-terminating and exhaustive models respectively. The bottom panel displays the coactive model predictions. The SIC(t) is plotted against arbitrary time units (AU).

