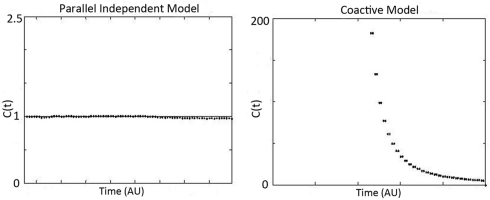
Figure 3.
Predicted workload capacity, C(t), for independent parallel models (left), and coactive models (right). Notice that coactive model predicts extreme super capacity, while independent parallel models predict C(t) = 1 (which is the benchmark for efficient audiovisual processing or integration). Standard serial models (generally) predict C(t) = 1/2 while parallel models with negative cross-talk can readily mimic such predictions.

