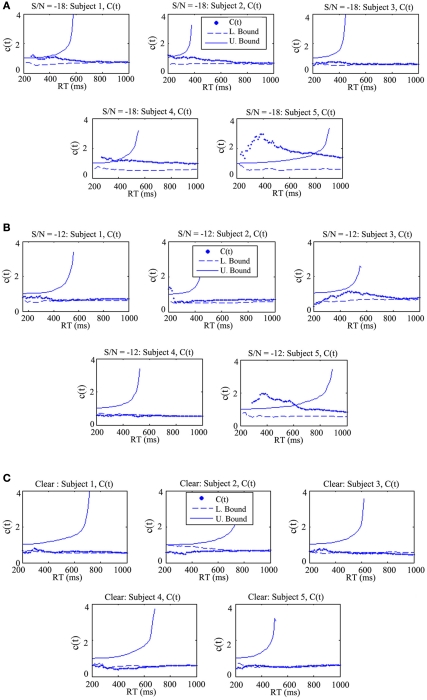
Figure 5.
The capacity coefficient C(t) for each participant across all three experimental conditions. The top (A), shows C(t) for five participants in the condition where the auditory S/N ratio was −18 dB. Each participant, except for Participant 3, evidenced super capacity (violating the bound C(t) = 1, or upper Miller Bound in capacity space; Eidels et al., 2011). The legend shows that C(t) is denoted by the dots, the upper bound by the solid curve, and the lower bound by the dashed line. (B) shows C(t) for five participants in the condition with an auditory S/N ratio of −12 dB, and the bottom (C) shows C(t) for five participants in the condition without any degradation of the auditory signal.

