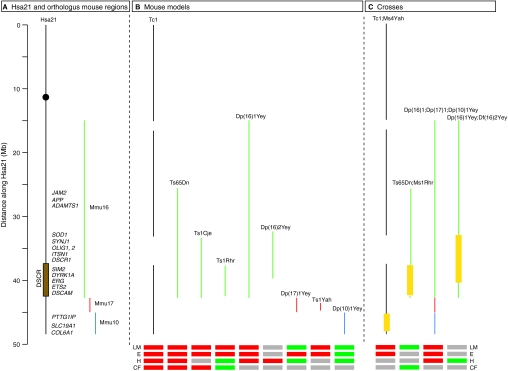
Fig. 1.
Hsa21, orthologous mouse regions and mouse models of DS. (A) A schematic diagram of Hsa21 indicating the approximate positions of candidate dosage-sensitive genes listed in Table 1, and of orthologous regions on mouse chromosomes 10 (blue), 16 (green) and 17 (red). The black circle indicates the centromere and the brown rectangle shows the approximate location of the DSCR. (B) The extent of trisomy in the mouse models of DS discussed in the text is shown. The Tc1 mouse carries a copy of Hsa21 (with some deletions), whereas the other models all contain duplications of mouse regions that are orthologous to Hsa21. (C) Crosses of mouse strains whose analysis has been reported. Where a strain with extra copies of genes has been crossed to a deficiency [Ms1Rhr, Ms4Yah or Df(16)2Yey], the regions where gene dosage has been reduced from three to two copies are indicated by a yellow box. Beneath B and C, red and green boxes indicate the presence or absence, respectively, of phenotypes in the following areas: learning and memory (LM), electrophysiology (E), heart (H) and craniofacial (CF). Grey boxes indicate that no analysis has been reported. Note that, in many cases, different assays have been used in the different models and crosses, making direct comparisons difficult, and in some cases the phenotypes result in an improvement rather than a defect, e.g. Ts1Yah shows improved learning and LTP responses compared with euploid controls. For further details see main text.

