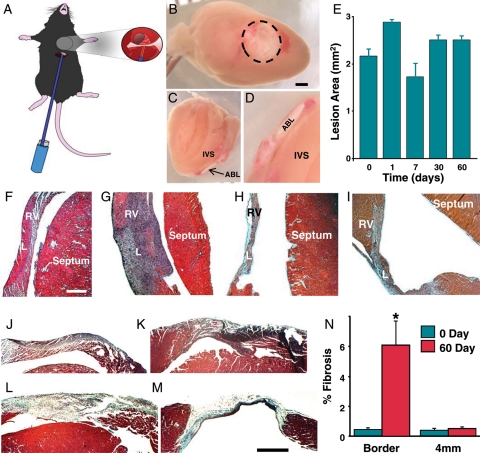
Figure 1.
Cross views of lesion and histological analysis. (A) Diagram of mouse instrumented with ablation electrode. Inset shows the electrode in contact with the heart. (B) Cross view of right ventricular lesion 1 day after ablation. Dashed line indicates lesion border. Scale bar is 1 mm. (C) Sagittal cross-sectional image showing transmural lesion. Ablation lesion. Intervnricular septum. (D) Magnified view of (C). (E) Average lesion area at different times following ablation. (F–I) H&E stained sagittal cross section of lesions at 0, 7, 30, and 60 days after energy delivery, respectively. RV, right ventricle; L, lesion. Scale bar is 50 mm. (J–M) Representative Gomori's trichrome-stained sections 0, 1, 7, and 60 days after energy delivery, respectively. Bar = 0.5 mm. N, average per cent fibrosis values at 0 and 60 days after energy delivery (n = 3) for each group. Asterisk indicates P = 0.03 compared with border at 0 day.

