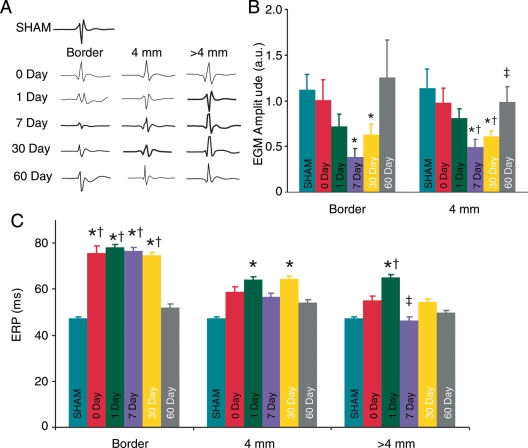
Figure 2.
Spatial and temporal changes in local electrogram amplitudes and effective refractory period. (A) Examples of local electrogram traces. (B) Average electrograms amplitude. *, †, and ‡ indicate significant differences compared with SHAM, Days 0 and 7, respectively. (C) Average effective refractory period measured at the border, 4 and 6 mm from the lesion. Asterisk indicates significant differences compared with SHAM. Dagger and double dagger indicates significant differences compared with 60 and 1 day, respectively.

