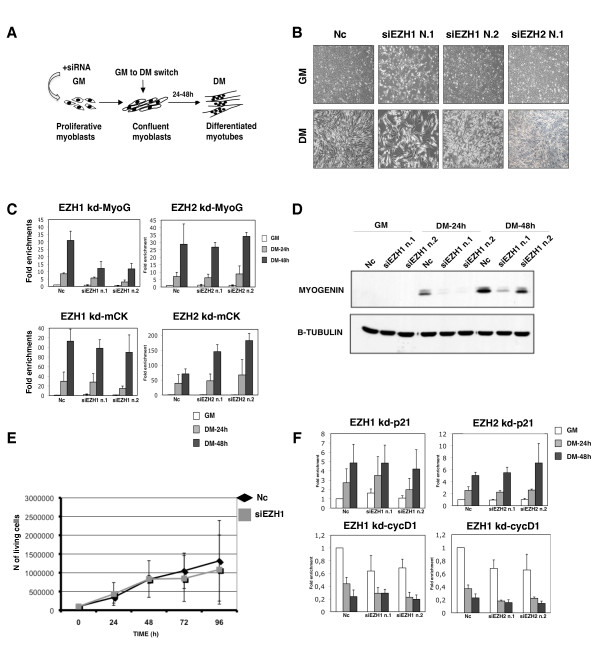
Figure 5.
Ezh1-depleted C2C12 cells show a delay of myogenin (MyoG) transcriptional activation. (A) Schematic representation of the design of small interfering RNA (siRNA) knockdown experiments used in this study. (B) Myoblasts were transfected with non-targeting siRNA (Nc = negative control) or siRNA against Ezh1 and Ezh2. The effect of siRNA on cell morphology was analysed in growth medium (GM) (48 h after transfection) and in differentiation medium (DM) (48 h after differentiation induction) by phase-contrast microscopy. A single siRNA for Ezh2, representative of two different siRNAs, is shown. (C) Expression levels of MyoG and muscle creatine kinase (mCK) muscle markers were analysed by real-time PCR in GM and in DM. Transcription levels were normalised to Gapdh expression and represented as the average of three independent experiments ± SD. Fold enrichment was calculated in comparison to the negative control siRNA in GM. (D) Ezh1-depletion was performed as described in (A) and MyoG protein levels were analysed using whole cell extracts prepared from cells cultured in GM and DM, respectively. β-Tubulin served as a loading control. (E) Effect of Ezh1 depletion on cell proliferation. The cells were counted 24 h, 48 h, 72 h and 96 h after siRNA transfection. Ezh1 siRNA oligo no. 2 was used. Graph shows data from two independent experiments. Error bars represent the standard deviation (Nc = negative control). (F) Expression levels of p21 and cyclin D1 genes were analysed by real-time PCR in GM and in DM (24 h and 48 h after differentiation induction). The transcription levels were normalised to Gapdh expression and represented as the average of three independent experiments ± SD. Fold enrichment was calculated in comparison to the negative control siRNA in GM.

