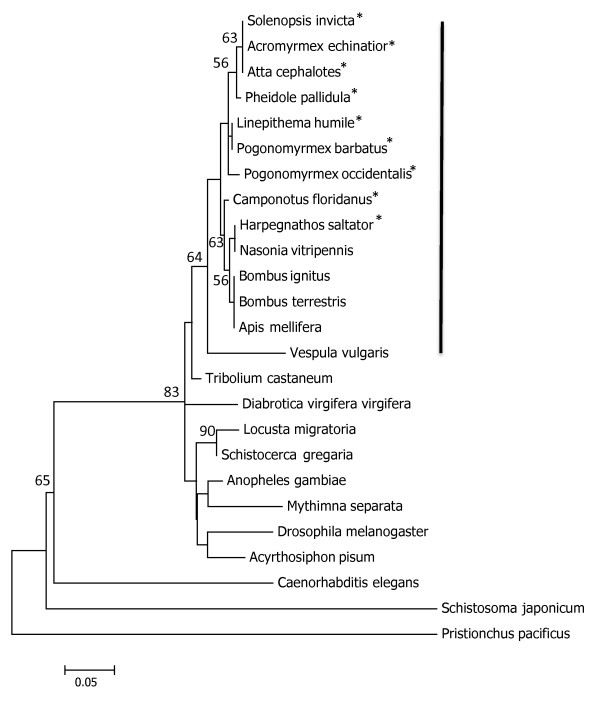
Figure 1.
Maximum likelihood analysis of foraging amino acid sequence. Maximum likelihood analysis of amino acid sequences of foraging from insect taxa with C. elegans, S. japonicum, and P. pacificus as outgroups. The tree shown represents the bootstrap consensus tree of 1000 replicates. Branch lengths represent the number of substitutions per site. All positions containing gaps and missing data were eliminated for a total of 367 positions in the final dataset. The black bar denotes the hymenopteran species, the non-social species are shown in bold type, and the ants (Formicidae) marked with an asterisk.

