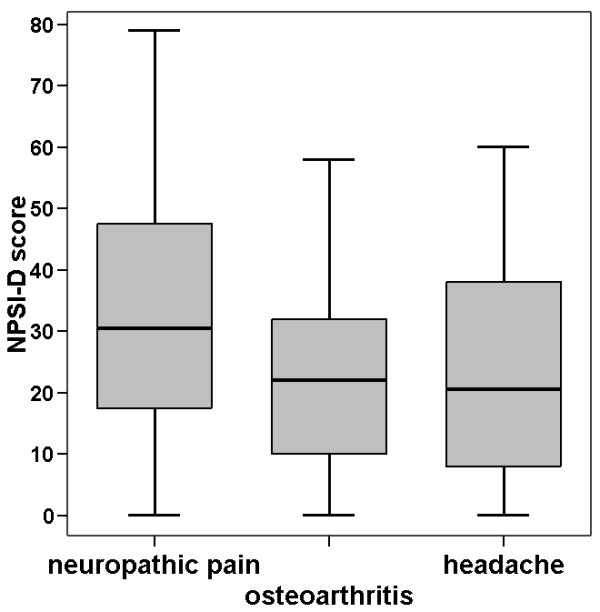
Figure 1.

NPSI-G score for different syndromes. The box plots show medians and ranges, the whiskers mark the first and the fourth quartiles. Outliers with a distance from the median that exceeds three times the box length are excluded. Differences between neuropathic pain and the other diagnoses are statistically significant (both p < 0.05).
