Figure 2.

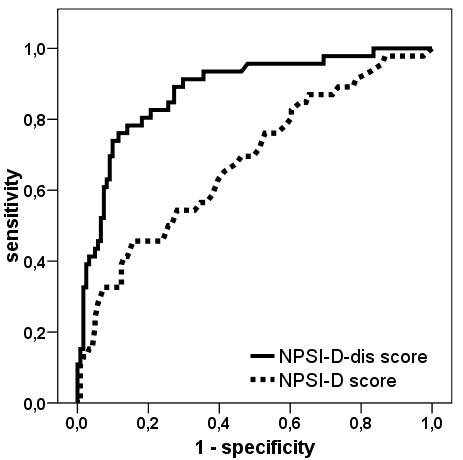
ROC-curves for the discriminant score NPSI-G-dis and the NPSI-G score. The graphs show the possible combinations of sensitivity/specificity values that can be achieved by varying the cut-off values for each score.

ROC-curves for the discriminant score NPSI-G-dis and the NPSI-G score. The graphs show the possible combinations of sensitivity/specificity values that can be achieved by varying the cut-off values for each score.