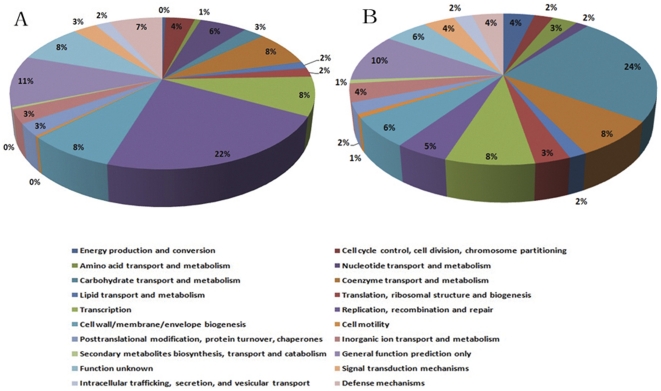
Figure 4. Comparison of COG functional categories between R61 strain-special genes and R61 strain-loss genes.
Each colored segment indicates the relative contribution of a functional category as a percentage of total COGs. The color of each COG family is indicated in the figure. (A), COG functional categories of R61 strain-special genes. (B), COG functional categories of R61 strain-loss genes.

