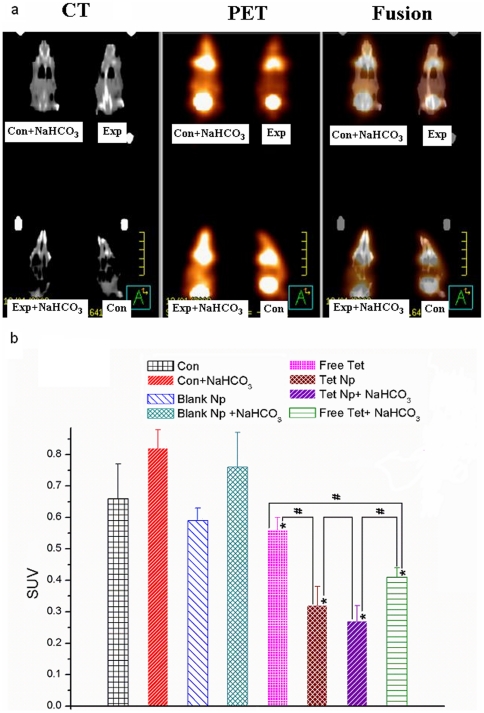
Figure 6. PET-CT scanning of the mice at the fifth day after treatment.
a. For each mouse, the tumor at the left side was injected with saline or free Tet while the tumor at the right was administrated with Blank or Tet-NPs. b. The SUV values of each group. * indicates that P<0.05 between the Exp/Blank groups and Con groups. (Exp/Blank vs Con, Exp+NaHCO3/Blank NaHCO3 vs Con NaHCO3). # indicates that P<0.05 between each two groups linked by lines.

