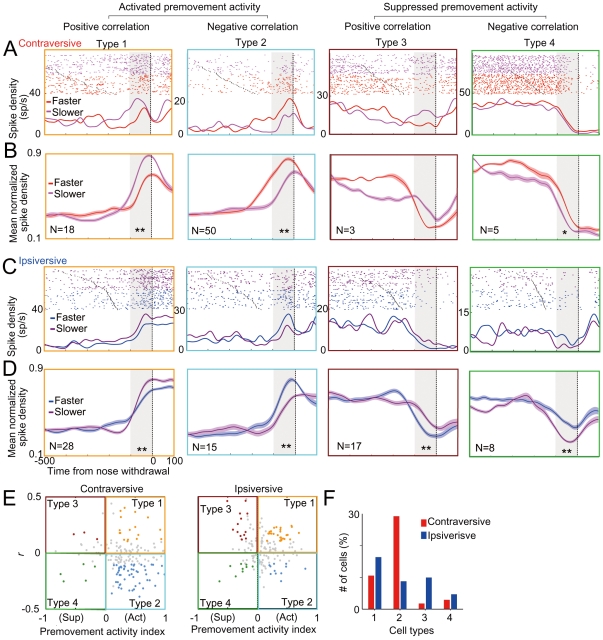
Figure 4. Classification of neurons.
Typical examples and their population average of 1–4 types of neuron for contraversive (A–B) and ipsiversive movements (C–D). Trials were sorted according to reaction time and divided into faster half and slower half reaction time trials by the median reaction time and SDFs were averaged for each reaction time group (A, C). The neurons shown in the type 1 and type 2 are the same as those shown in Fig. 2A–C and Fig. 3A, respectively. Population average of mean normalized SDFs of neurons that satisfied criteria (see Methods) for contraversive (B) and ipsiversive movements (D). * p<0.05, ** p<0.001 in paired t-test. (E) Scatter plots indicating the premovement activity index plotted against correlation coefficient between reaction time and firing rate in the premovement period. The premovement activity index is a normalized premovement activity so that 0 equals the spike density during the prestimulus baseline period (see Methods). The four colors of dots are used to code neuron types 1–4 that fall in one of four quadrants in the scatter plots with defined criteria (see Methods). (F) Percentage of each type of neuron for ipsiversive and contraversive movements (n = 171).

