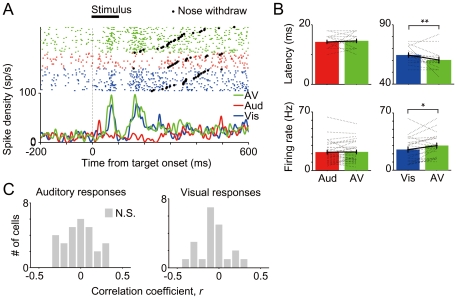
Figure 6. Sensory-evoked responses.
(A) Examples of a sensory-motor neuron showing visually-evoked responses. Raster plots and spike density functions (SDFs) were aligned to stimulus presentation. Trials in the raster plot were sorted according to reaction time. The data were derived from only correct trials in response to the stimuli presented to contralateral stimuli. (B) Comparisons of latencies and firing rates of sensory-evoked responses between unisensory and multisensory stimulus conditions in the multisensory cells. The dotted lines show latencies and mean firing rates of evoked responses for each cell (n = 29, 21 for auditory- and visually-evoked responses, respectively). The histograms and error bars show the means and standard error across cells, respectively. *p<0.05, **p<0.01 in paired t-test. (C) Distribution of correlation coefficients between reaction time and firing rate in the sensory-evoked response periods of visual or auditory responsible cells (n = 32, 17 cells for auditory and visual responses, respectively).

