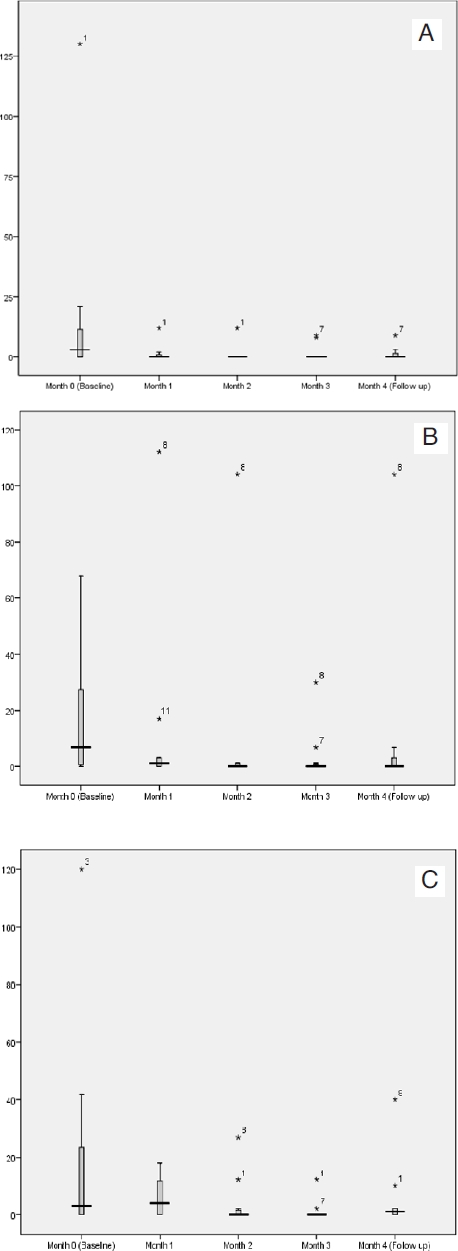
Figure 1.

Episodes of incontinence of (A) wind, (B) liquid and (C) solid with PTNS. Boxes represent 1st to 3rd quartile. Horizontal line delineates the median. Error bars represent inner and outer fences (1.5 × interquartile range). Individual patient outliers are labelled.
