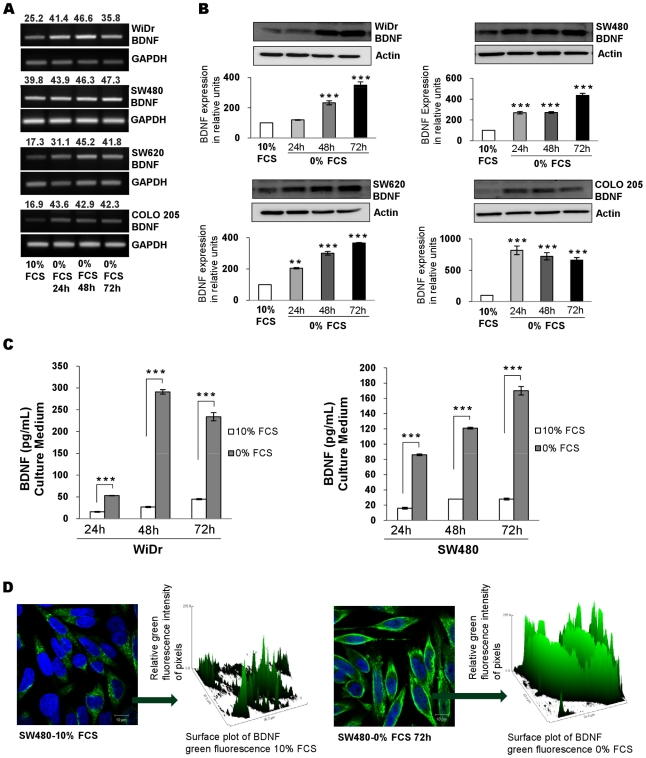
Figure 2. Comparison of BDNF production in CRC cells cultured with 10% or without FCS (0% FCS).
(A) BDNF production assessed by RT-PCR of total RNA extracted from cells cultured in basal condition (10% FCS) and for 24 to 72 h of serum deprivation. Quantification of band intensities is shown as above (mean of three independent experiments). (B) BDNF expression by western blotting (in reference to actin) in total cellular protein extracted from cell lines cultured under basal condition (10% FCS) and after 24–72 h of serum deprivation (0% FCS). According to densitometric analyses, quantification showed a significant increased expression of BDNF in cultured cells. Histograms are means ± SEM of at least three independent experiments. **, p<0.01; ***, p<0.001, in comparison with basal culture conditions. (C) Secretion of BDNF assessed by ELISA in supernatant of the WiDr and SW480 cell lines under basal condition (10% FCS) and after 24–72 h of serum deprivation (0% FCS). Results are expressed as the mean ±SEM of triplicates from three different experiments. ***, p<0.001, when compared with basal culture condition. (D) Comparison of BDNF expression by SW480 cells cultured in 10% FCS and after 72-h serum deprivation. Confocal microscopy with anti-BDNF Ab and Alexa fluor-488 conjugate (green) and nuclei counter stained with the blue-fluorescent DNA stain DAPI. Relative quantification was assessed by green fluorescence surface plot. Images were representative for at least three independent experiments. Scale bars, 10 µm. Similar results were observed with the three other lines (data not shown).

