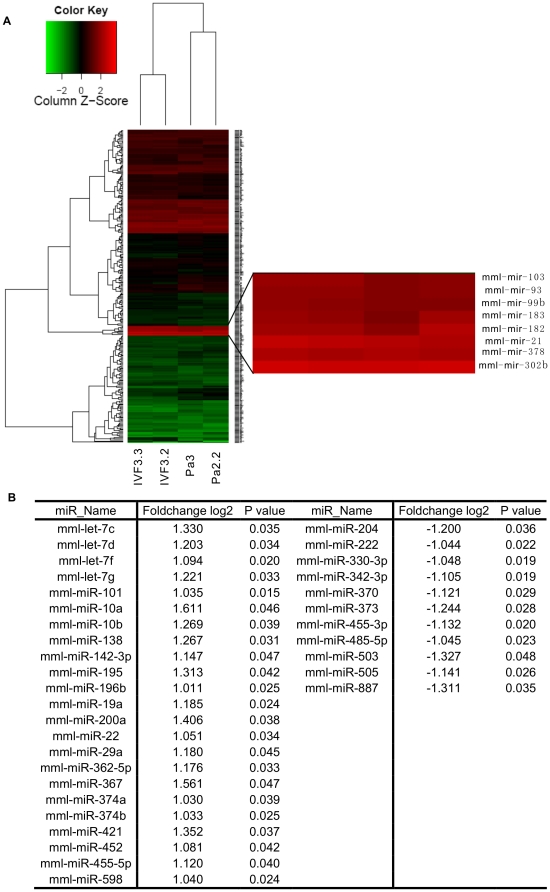
Figure 4. Comparison of miRNA expression between parthenogenetic and IVF rhesus monkey ESCs.
A, heat-map of hierarchical clustering of miRNAs expression in parthenogenetic and IVF rhesus monkey ESCs. Right shows miRNAs whose expression more than 10000 counts TPM. B, miRNAs remarkable up- or down-regulated(fold-change>2,p<0.05) in rpESCs comparing with IVF rhesus monkey ESCs.

