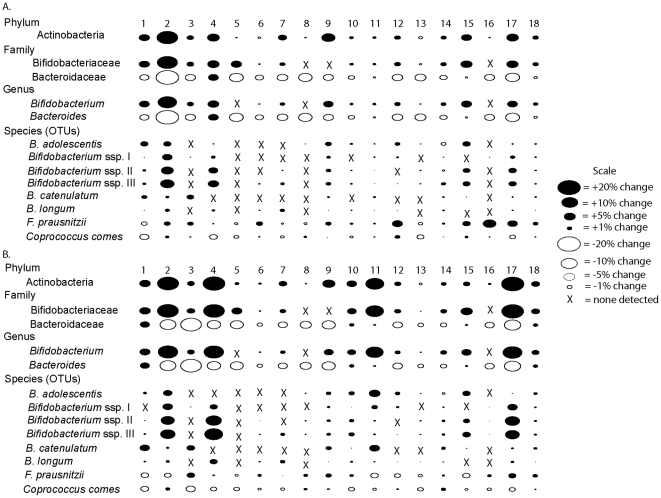
Figure 2. Bubble plots showing differences in the proportions of bacterial taxa as a percentage of the entire bacteria population detected during consumption of 5.0 g (A) and 10.0 g (B) when compared to the control period.
The size of the bubbles is representative of the percent difference. Black ovals represent increases in proportions observed during the GOS consumption period; white ovals represent decreases.

