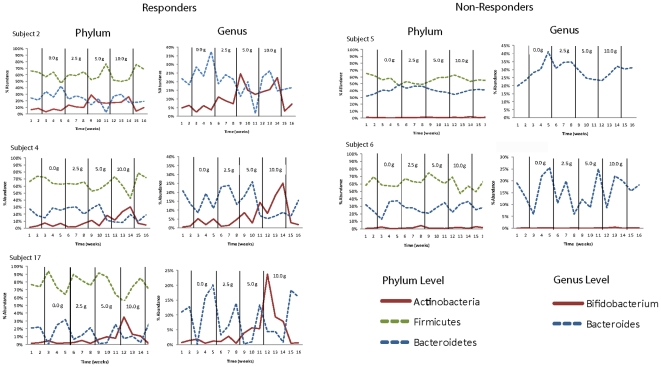
Figure 3. Temporal dynamics of the human fecal microbiota in response to the consumption of increasing doses of GOS shown in five human subjects.
Graphs on the left show proportions of the three main phyla (Actinobacteria, Firmicutes, and Bacteroidetes) and two genera (Bifidobacterium and Bacteroides) that were affected in subjects considered as “responders”. Graphs on the right show proportions of the same three phyla and two genera for subjects considered as “non-responders”.

