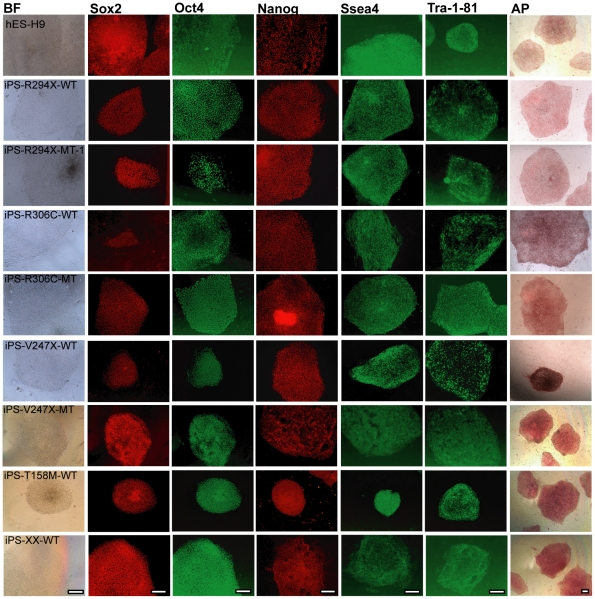
Figure 1. RTT iPSCs express the same set of pluripotency markers as previously characterized hESC and hiPSCs lines.
Representative images of hESC (H9) and hiPSC colonies stained with antibodies against pluripotency markers Sox2, Oct4, Nanog, Ssea4, and Tra-1-81, and processed for alkaline phosphatase reaction. Each row represents colonies from one hESC or hiPSC line. iPS-XX-WT was derived from a healthy female. Each column represents one pluripotency marker. BF stands for bright field. Scale bars = 200 µm.

