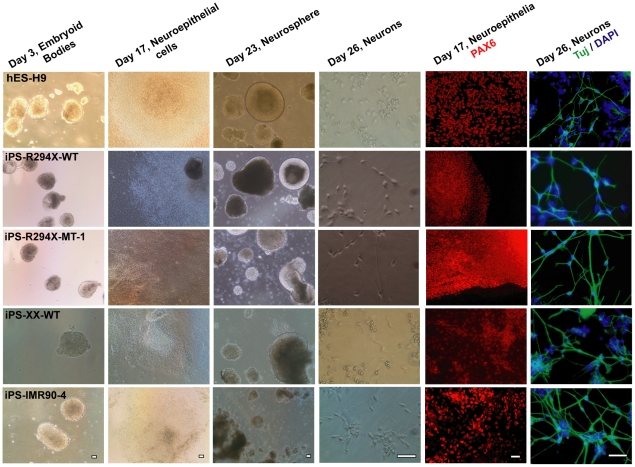
Figure 4. Isogenic pairs of wild type and mutant RTT iPSC lines efficiently differentiate into post mitotic neurons.
Left 4 columns: representative transmitted light microscropy images at key stages of the directed neuronal differentiation. Each row represents differentiation from one hESC or hiPSC line. Each column represents one key stage of the differentiation. Right 2 columns: representative fluorescence images of expression of neuroepithelial marker PAX6 and postmitotic neuron marker beta III tubulin (Tuj). Each row represents differentiation from one hESC or hiPSC line. Scale bars = 200 µm.

