Figure 4.
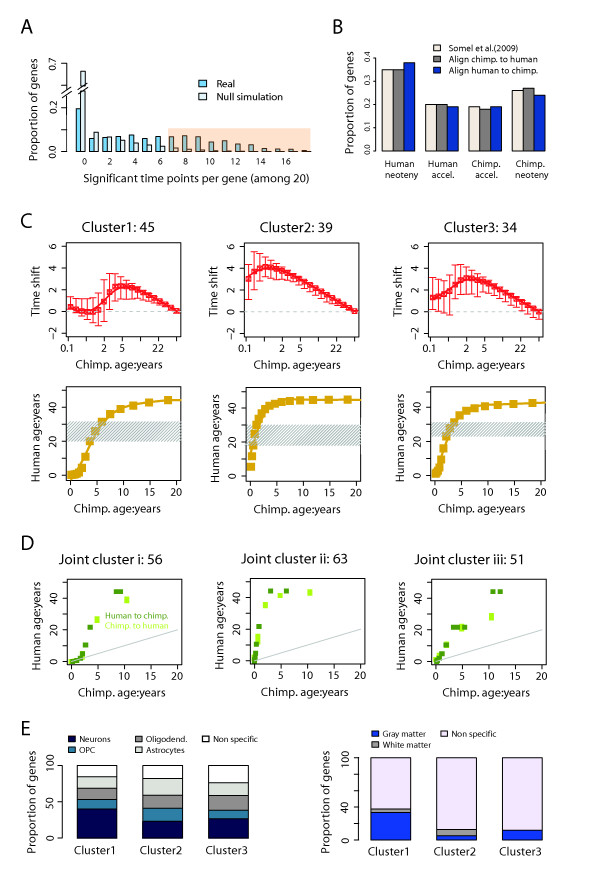
Human-chimpanzee expression heterochrony analyzed by DTW-S. (A) Numbers of significant time shift points per gene for 1183 genes tested for heterochrony in the primate brain expression dataset. The x-axis shows the number of interpolated time points (out of a total of 20) with significant time shift (p < 0.05) estimated using DTW-S (blue), as well as the mean time points in 50 simulated datasets (light blue). The simulation is based on the human expression time series (see Methods). In this case, the FPR is ~10% for genes with ≥7 points showing significant time shift (denoted by the light pink shaded area). In this analysis, we have aligned chimpanzee expression time series to human time series. (B) Proportions of genes assigned to four phylo-ontogenetic categories. The labels are the four phylo-ontogenetic categories (see Results). The colors indicate gene classification into the phylo-ontogenetic categories stated in the original publication [15], carried out using the DTW-S algorithm by aligning chimpanzee expression time series to human time series, or aligning human expression time series to chimpanzee time series. (C) Patterns of time shift between human and chimpanzee time series for genes with human-specific neotenic expression, calculated by aligning chimpanzee expression time series to human time series. The numbers above each graph represent numbers of genes within the cluster. The upper row panels show time shift estimates for mean shift based on all genes in a cluster (red lines) and the distribution of the shifts (arrows) for individual genes within clusters (5%-95%). Positive values of time shift indicate that human ages are mapped to younger ages in the chimpanzee time series, indicating slower/delayed human development. Time shift shown on the y-axis is calculated as the base-two logarithm ratio between chimpanzee age and human age at aligned expression time points. The bottom row panels show the relationship between human and chimpanzee ages, based on the calculated time shift estimates shown on the upper row (yellow lines). Shaded areas show the human age range corresponding to the maximum shift interval. (D) Panels show the relationship between human and chimpanzee ages, based on all the calculated significant time shifts between human and chimpanzee time series for genes with human-specific neotenic expression. The genes are identified as neotenic either by aligning chimpanzee to human time series, or by aligning human to chimpanzee time series. The numbers above each graph represent numbers of genes within the cluster. (E) Properties of genes in three clusters defined based on their human-chimpanzee time shift patterns as shown in (C). The left panel shows the proportion of genes in each of the three clusters that overlap with genes that are expressed preferentially in a particular cell type: neurons, oligodendrocyte precursor cells (OPC), oligodendrocytes, astrocytes or non-specific. The right panel shows the proportions of genes in each of the three clusters that overlap with genes that are expressed preferentially in gray matter, white matter or non-specific.

