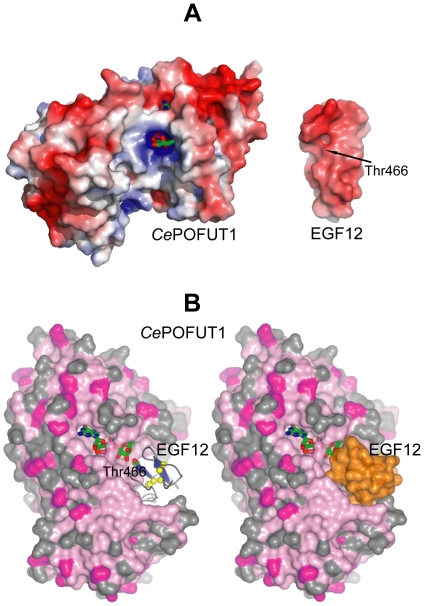
Figure 4. Localisation of EGF repeat binding site in CePOFUT1.
(A). Electrostatic surface representation of CePOFUT1 and HsEGF12 (PDB code 2VJ3). CePOFUT1 has an overall positive charge in the sugar and acceptor binding site while HsEGF12 is negatively charged around Thr466 [56]. GDP-fucose is shown as sticks with green carbon atoms while Thr466 is indicated by an arrow. (B). Docking of HsEFG12 into CePOFUT1. CePOFUT1 is represented as a surface model colored by sequence conservation, while HsEGF12 is shown either as ribbon representation on the left (β-strands are in blue and the three disulphide bridges are highlighted in yellow) or as a surface model (in orange) on the right. GDP-fucose and Thr466 are shown as sticks with green carbon atoms.

