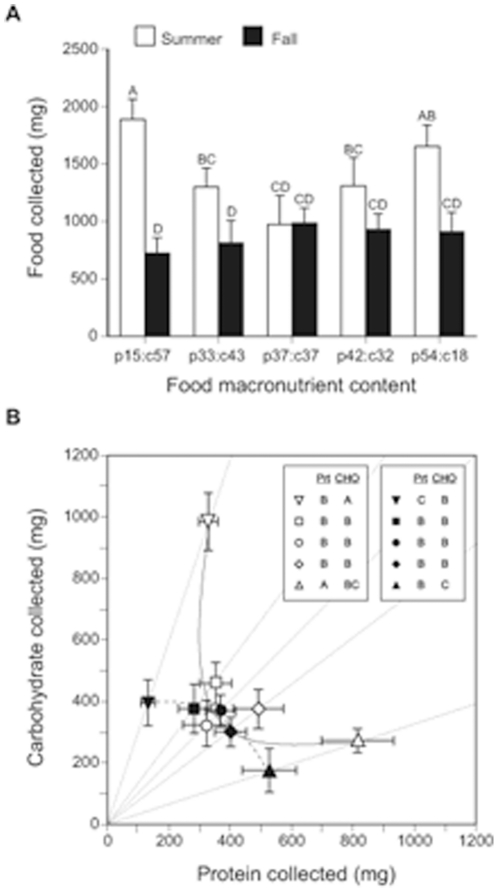
Figure 1. Food and nutrient collection for summer and fall colonies on diets with different protein-carbohydrate ratios.
Panel (A) shows the mean (± S.E.) amount of food collected, over 5 weeks, by summer (open columns) and fall (filled columns) colonies. Significant differences in food collection between the food treatments for summer colonies are indicated by different capital letters above columns. Panel (B) shows the mean (± S.E.) amount of protein and carbohydrate collected, for the same five diets, for summer (open symbols) and fall (closed symbols) colonies. The lines emanating from the origin represent the p:c ratio of five diets: inverted triangle (19% protein, 57% carbohydrate; p19:c57); square (p33:c43); circle (p37:c37); diamond (p42:c32); and triangle (p54:c18). The solid and long-dashed curves represent the fitted intake arrays (see text for details) for summer and fall colonies, respectively. Different letters in the figure legend indicates significant differences in protein and carbohydrate collection between the diets (for each season).

