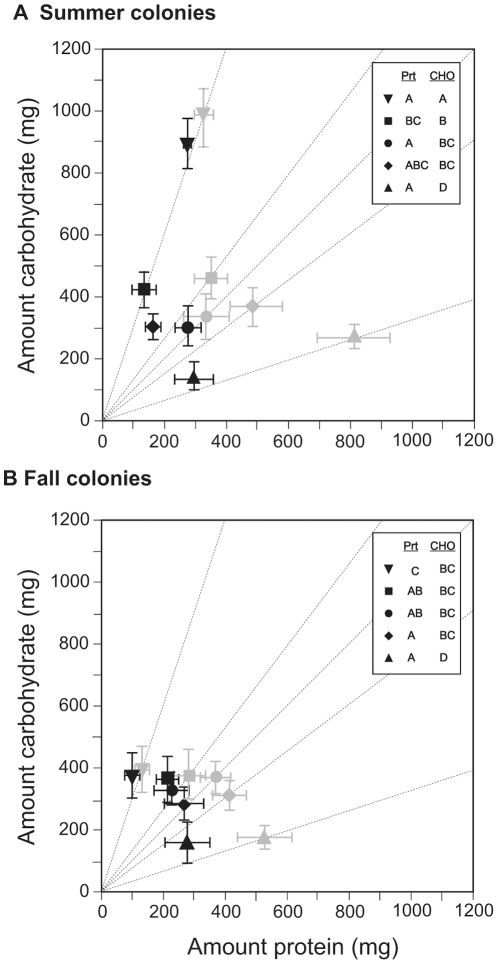
Figure 2. Nutrient consumption for summer and fall colonies on diets with different protein-carbohydrate ratios.
These figures show the mean (± S.E.) total amount of protein and carbohydrate consumed [dark symbols in both panel (A) and (B)] and collected [light grey symbols in both panel (A) and (B); data from Figure 1B]. The dashed lines emanating from the origin represent the protein-carbohydrate (p:c) ratio of five diets: inverted triangle (19% protein, 57% carbohydrate; p19:c57); square (p33:c43); circle (p37:c37); diamond (p42:c32); and triangle (p54:c18). Protein consumption was calculated by subtracting the amount of protein in unconsumed foods from the amount of protein from collected food; carbohydrate consumption was calculated using a similar approach (see Supporting Methods and Results for complete details; also see Fig. S1). Different letters in the figure legend indicate significant differences in protein and carbohydrate consumption between the diets.

