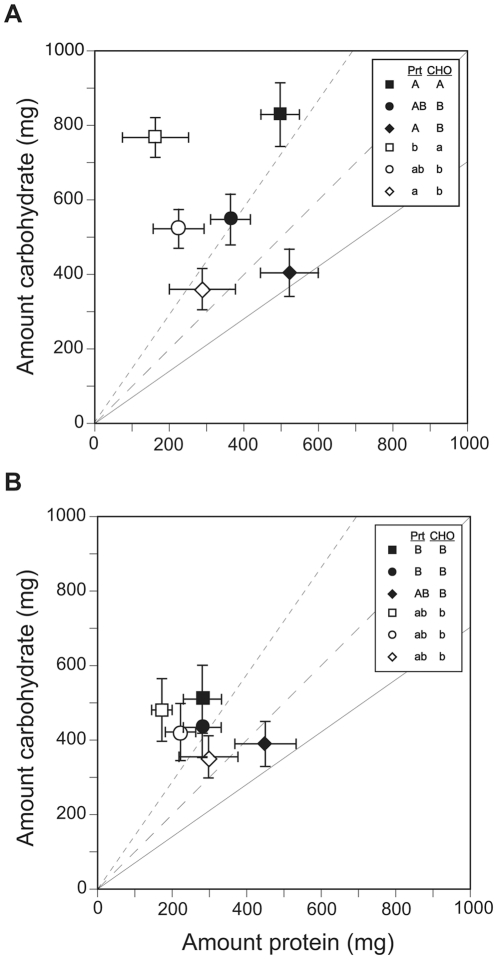
Figure 4. Nutrient collection and consumption for summer and fall colonies on nutritionally complimentary food pairings.
The mean (± S.E.) total amounts of protein and carbohydrate collected (filled symbols) and consumed (open symbols) by summer (A) and fall (B) colonies on the three food pairings comprising choice treatments over five weeks. Symbols represent food pairings: Squares (treatment 1) = food p19:c57 with food p42:c32; Circles (treatment 2) = food p19:c57 with food p54:c18; and Diamonds (treatment 3) = food p33:c43 with food p54:c18. Small dash, large dash, and solid lines emanating from the origin represent the protein:carbohydrate ratio of collected food if foragers collected equally from the two food dishes comprising treatment one, two, and three, respectively. Different capital and lower-case letters in the figure legend indicates significant differences in protein and carbohydrate collection and consumption, respectively between the diets (for each season).

