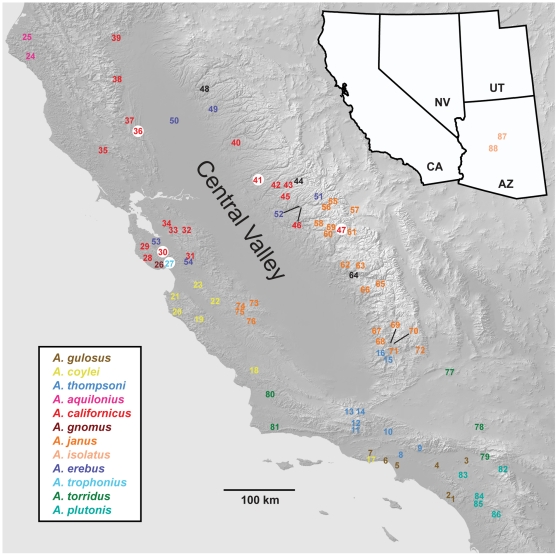
Figure 1. Map of California showing sampling localities, with colors corresponding to species (see insert).
Sites with species syntopy highlighted with a white circle (27: A. trophonius & A. californicus; 30, 36, 41: A. californicus & A. erebus; 47: A californicus & erebus group immature). Black text designates locations where immature specimens could not be confidently identified. Detailed collection information can be found in Table S1.

