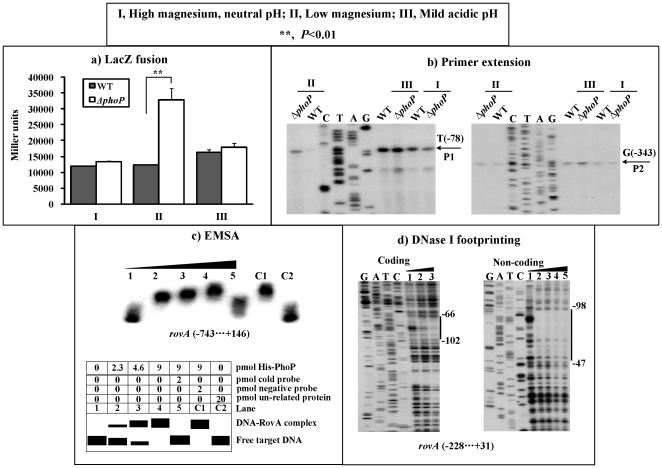
Figure 5. PhoP repressed rovA transcription.
Only the bacterial cells of “shift from 26 to 37°C” at the middle-exponential growth phase were analyzed herein. a) LacZ fusion. The rovA-lacZ fusion vector as described in Fig. 3a was transformed into WT or ΔphoP to determine the rovA promoter activity (Miller units) when the bacteria were grown under conditions I, II and III, respectively. b) Primer extension. The P1 and P2 promoters of rovA were detected in ΔphoP or WT grown as described above. Lanes C, T, A, and G represent the Sanger sequencing reactions. c) EMSA. The labeled promoter-proximal fragment of rovA as described in Fig. 3c was incubated with increasing amounts of purified His-PhoP. Shown on the lower side is the schematic representation of the EMSA design. Lanes C, T, A, and G represent the Sanger sequencing reactions. d) DNase I footprinting. The labeled DNA fragment from 228 bp upstream to 31 bp downstream of rovA was incubated with increasing amounts of His-PhoP. Lanes 1, 2, 3, 4 and 5 contained 0, 34.6, 41.5, 48.4 and 59.3 pmol, respectively. Vertical bars indicate the protected regions, whereas the negative numbers denote the nucleotide positions upstream of rovA. Lanes C, T, A, and G represent the Sanger sequencing reactions.

