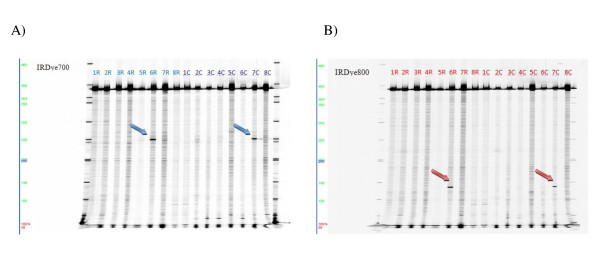
Figure 3.
Pooling strategy for Exon 1 of the GLA gene - The 16 lines represent the 16 pools obtained through the pooling strategy for rows (1R-8R) and columns (1C-8C). Above, PCR products undigested at 390bp, visible in both detection channels. (A) Images obtained in the 700 nm channel for the identification of fragments marked by the forward-IRDye700 primer. (B) Images obtained in the 800nm channel for the identification of fragments marked by the reverse-IRDye800 primer. The 6R and 7C pools show fragment sizes of approximately 135 bp, indicated by blue arrows (for IRDye 700), and 255 bp, indicated by red arrows (for IRDye 800). Sizes of the digested fragments indicate the position of the mutation within the amplicon, and their sum comprises the dimensions of the undigested 390 bp fragment.

