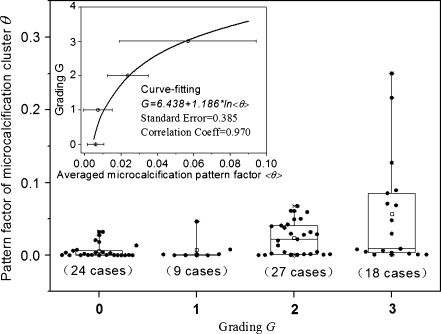
Fig. 3.
The box-data overlap plot of original retrospective data (78 cases), and the outliers outside 95% confidence interval are marked. Inset the graphic dependence of pathological grading G upon the averaged microcalcification pattern factor <θ>. The curve is fitted to the retrospective data by the method of least squares nonlinear fit, and the pattern factorθ becomes larger as well as more dispersive with increasing grade G

