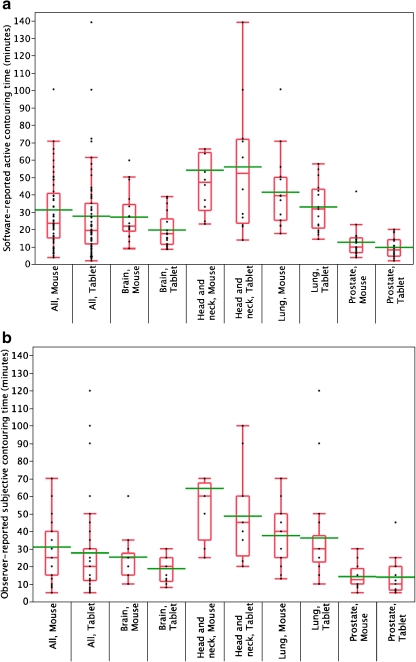
Fig. 3.
Quantile boxplot of distribution of objective (a) and subjective (b) time parameters, substratified by anatomic case and UID. Whiskers represent the 0–100th percentile range, box encompassing 25th and 75th percentiles. Median is indicated by horizontal line within box, with mean line in green

