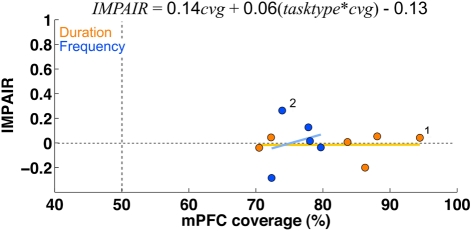
Figure 13.
Medial prefrontal cortex lesions: there was little to no impairment in either group following lesions of areas PrL and IL, despite large coverage of these areas. There was also no correlation between impairment and lesion coverage. The graph shows impairment (measured by IMPAIR, y-axis) relative to the coverage extent of medial prefrontal cortex (x-axis; defined as areas PrL and IL). Each point shows data for one ibotenic acid-injected animal (n = 11; timing = 6, frequency = 5). A linear regression showed that neither coverage extent on its own nor in an interaction with task type significantly explained impairment (tasktype*cvg coefficient = 0.06; 95%CI = [−0.27, 0.38]; cvg = 0.17; 95%CI = [−1.61, 1.95]); task type was coded as an indicator variable (frequency = +0.5, duration = −0.5). No saline controls were conducted for this experiment.

