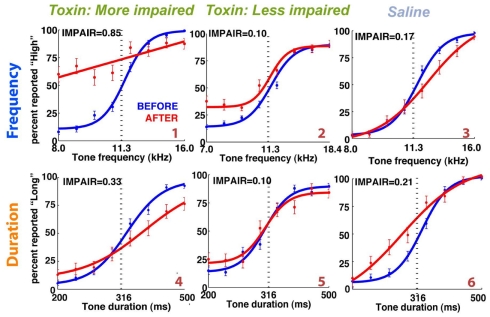
Figure 6.
Representative individual psychometric curves of frequency (top) and duration (bottom) group animals. Each panel shows the performance of an animal before (blue) and after (red) injections bilaterally into the auditory cortex, with the degree of impairment (IMPAIR) shown in the top-left corner. The coverage for each animal (identified by the red numeric in the bottom-right) is shown in Figure 9). Pairs of [stimulus duration/frequency, side choice] were fitted using a logistic function, or a line, to generate psychometric curves. Individual points along a curve are averages of binned values ± SEM in log(stimulus) space. See Section “Materials and Methods” for details and justification of IMPAIR score.

