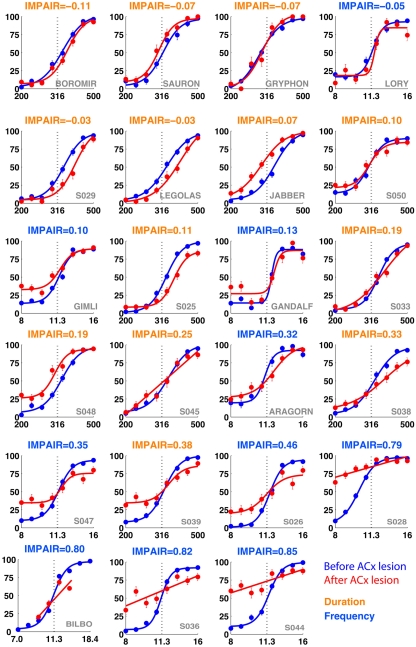
Figure 7.
IMPAIR measures reflect the degree of impairment in individual animals following auditory cortex (ACx) lesions. Each panel shows the performance in the psychometric phase of the task before (blue) and after (red) bilateral ACx lesions, with task type indicated by the color of each heading (DURATION in orange, FREQUENCY in blue); panels are sorted in increased order of IMPAIR measure. For duration group animals, x-axis represents log(tone duration) and y-axis, the percent reported “Long.” For frequency group animals, x-axis represents log(tone frequency) and y-axis, the percent reported “High.” Note that increased IMPAIR values accompany a flattening of the slope of the curve and decrease in performance at the ends of the stimulus range, but that these can vary independently to different extents (compare “Gandalf” at position [3,3] to “S045” at [4,2]). Error bars show SEM.

