
Figure 1. Morphological and electrophysiological characterization of SNr neurons.
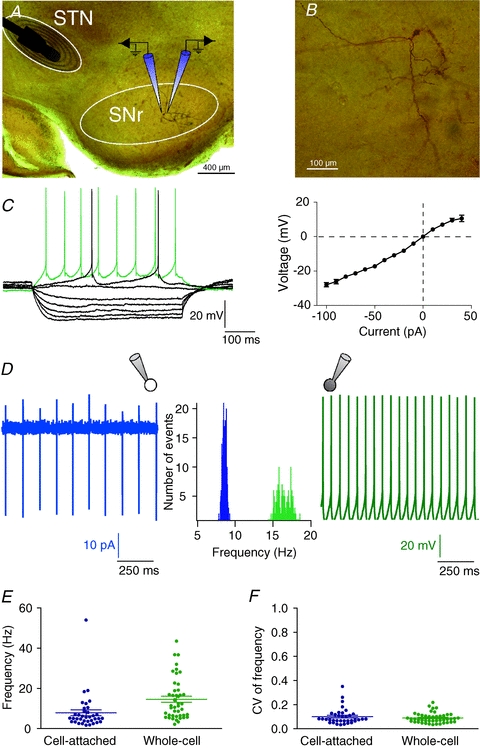
A, brightfield micrograph of a parasagittal STN-SNr slice counterstained with safranin. The stimulation electrode was placed in the STN and SNr neurons were recorded by double patch-clamp; one cell of the pair was recorded in cell-attached and the other neuron in whole-cell configuration. B, high magnification view of the SNr neuron shown in A, injected with biocytin. C, characteristic membrane properties and spiking pattern of one SNr neuron recorded in whole-cell mode. Note the inward and outward rectification illustrated in the steady-state I–V relationship, right. Raw traces show individual voltage responses to series of 500 ms current pulses of −100, −80, −60, −40, −20, 0, 10 and 40 pA. D, example of tonic firing activity of two neighbouring SNr neurons, one in cell-attached (left) and one in whole-cell (right) mode. The firing rate distribution (middle panel) of this representative neuronal pair illustrates the significant difference existing between the recording modes (9.24 ± 1.9 Hz, n = 36 in cell-attached vs. 16.9 ± 1.54 Hz, n = 37 in whole-cell, P < 0.0001). E, distributions of the firing frequency (left) and the coefficient of variation (CV) of the firing frequency (right) of recorded neurons, in cell-attached (n = 36 neurons) and in whole-cell (n = 45 neurons) configurations. Note that in both configurations, SNr neurons displayed a regular spiking.